How to build an interactive PDF in Flex
Turn a static report, one-pager, or spec sheet into an interactive Flex experience. Pull a bento summary, anchor nav, and chart component from the library and publish in under an hour.
BY Lydia Burns
September 23rd 2026 – 5 minutes
GUIDES & TOOLS
How to build an interactive PDF in Flex
Nobody finishes a 40-page PDF. You skim the summary, glance at a chart, and close the tab...and honestly, that's fair. Build the same report in Flex, and people stick around: they click through the chart, jump straight to the section they need, and find it later when they ask an AI search engine about it, something a plain PDF never will. Here's how to build your own, using the same Components Library as the rest of this series.
What is an interactive PDF?
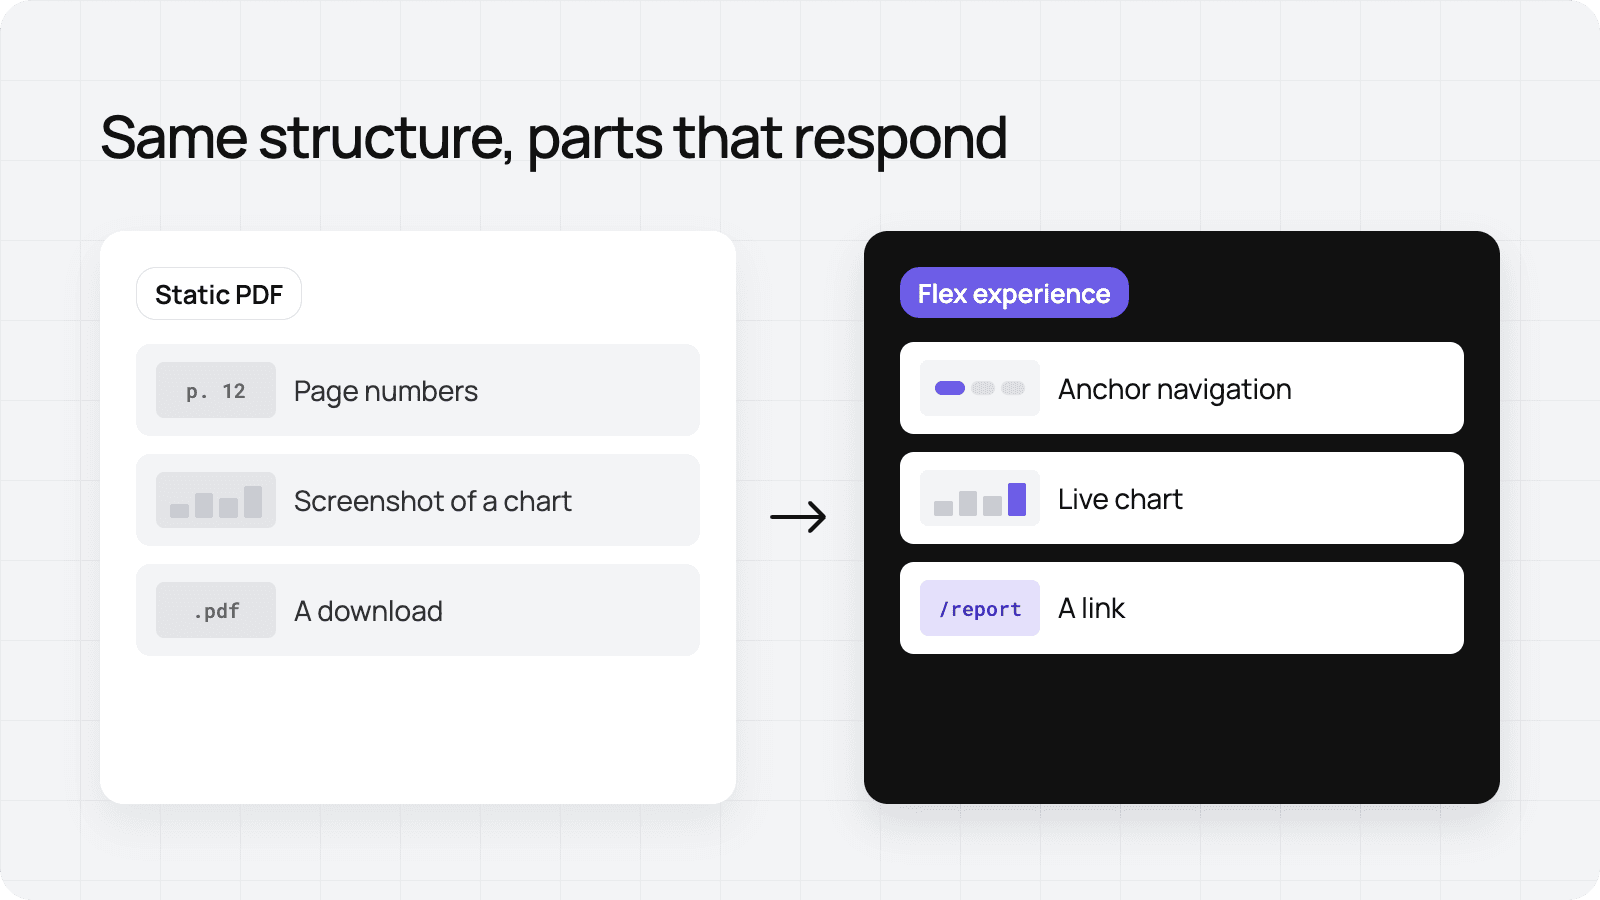
An interactive PDF isn't a PDF at all. It's a Flex experience built to replace one: a report or spec sheet that lives at a link instead of a download. It keeps a document's structure but swaps the static parts for ones that respond — anchor navigation instead of page numbers, and a live chart instead of a screenshot.
Start with the document you already have
You don't need a new idea. You just need the report, spec sheet, or one-pager already sitting in your team's Drive. Any document built around a summary-then-sections structure is a strong candidate: annual reports, product spec sheets, sales one-pagers, and research summaries.
Before you touch the canvas, decide what job this piece needs to do. A gated report meant to prove a point front-loads its strongest stat. A spec sheet meant for procurement leads with the table of details. A sales one-pager built to close leans on a single CTA. That decision shapes which components you reach for first.
Reach for the right components
The Components Library has the pieces of a document, rebuilt for the web. Here's what to reach for, organized by the job each one does.
Summarize before the scroll. A bento-grid summary block gets the whole story in front of your reader before they've decided whether to keep scrolling.
Let readers skip around. A jump-to-section nav replaces a table of contents with links that actually work, so a reader who only cares about pricing doesn't have to scroll past your methodology.
Land a number. A number buried in a table row is a number nobody remembers. An animated stat card gives it room to breathe, and counts up on scroll so it actually lands.
Show the data, not a screenshot of it. A screenshot of a chart is just a picture of data you can't touch. Swap it for a live chart component your reader can hover and filter.
Let a section stay closed until someone wants it. Not every reader needs your full spec table. An expandable accordion keeps it out of the scroll until someone actually asks for it.
Close with an ask. A one-pager that ends on a paragraph isn't finished. Match a CTA button to what actually happens next: download, book a demo, get in touch.
Pull whichever match the document you're rebuilding — a one-pager might only need three of these; a full report will use all five.
Drop them onto your canvas
Every component page has a Copy component button. Click it, open your Flex canvas, and paste. That's it.
A couple of things worth knowing for a document-shaped build specifically:
Keep the anchor nav in sync.
If you add or reorder sections after building the jump nav, update its links. Nothing kills the "interactive" pitch faster than a nav that jumps to the wrong place.
One chart, one job.
A single clear chart beats three crammed into one section. If your source PDF has a dense data appendix, that's a candidate for the expandable accordion, not five stacked charts.
Layer in the SDK
This is where the piece stops feeling like a PDF someone dumped into a webpage. Flex SDK powers anything logic-based — a stat that counts up on scroll, an accordion that tracks which section gets opened most, a chart that updates based on a filter click.
Name it before you script it. Whatever you're driving—a stat counter, a chart, an accordion—give it a locator in the SDK Locators inspector. That's what your script, or Flex AI if you're prompting it, hooks into.
A pattern worth knowing: if your report has regional or segment-specific data (by industry, by region, by plan tier), wire a filter so one chart swaps its dataset on click instead of publishing five near-identical charts. It's the difference between a document that got moved online and one that was actually built for the web.
Still need an actual PDF?
Some readers will ask for one anyway, no matter how great the interactive experience is. Publish your Flex experience first, then use Flex's export-to-PDF option to generate a print-ready version from the same build. You're not maintaining two documents; you're generating a fallback for the room that still wants one.
(Looking for a faster way? One where Flex AI reads an existing PDF and generates a first draft for you? See how to convert static designs to interactive with Flex AI. This guide covers building one from the Components Library instead, for when you want more control over the structure from the start.)
Best practices
Use Fully Responsive mode. A report or spec sheet meant to rank and get shared needs to hold up across screen sizes—Fully Responsive mode is built for that. Scale mode is fine for a fixed-width embed, not for a page you want indexed.
Don't let your anchor nav outrun your content. If a linked section is one sentence long, it doesn't need its own nav item. Group short sections together instead.
Test the PDF export before you rely on it. Interactions, pop-ups, and hidden carousel items don't carry over to the exported PDF. It only captures what's visible on the page. If a section depends on a click to reveal its content, make sure that content still reads in the static export, or treat the PDF version as a lighter companion, not a full mirror.
Bonus: prompts for building an interactive PDF from scratch
Turning a written report into a first draft:
Build a fully responsive interactive report experience from this [doc link]. Structure it with a bento-grid summary up top, a jump-to-section nav, and [X] sections below. Use the actual copy and numbers — don't generate new ones.
Building a bento-grid summary section:
Create a bento-grid summary layout with [X] tiles, each showing one key stat or takeaway. Match it to [describe layout/tone].
Building a filterable chart:
Build a chart that filters between [X] datasets based on a button or dropdown selection. [Describe the data and what should update.]
The pattern holds across this series: specific inputs get you a usable result fast. Vague prompts are where the back-and-forth creeps in.
How to build an interactive PDF in Flex FAQs
How to build an interactive PDF in Flex FAQ
There you have it!
Ready to retire your next static report? Start a free trial of Flex and pull your first component onto the canvas.